Population Ratio within Jumma Communities
![]()
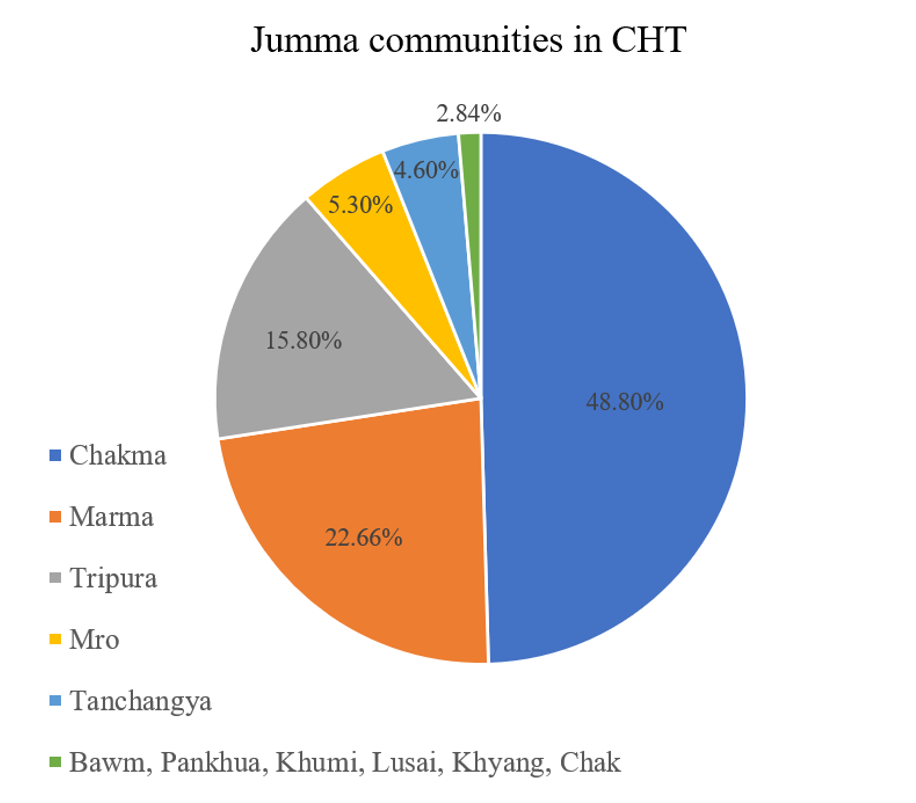
Population Ratio within Jumma Communities (Source: BBS, 2022)
The pie chart illustrates the population distribution of the Jumma communities in the Chittagong Hill Tracts (CHT) of Bangladesh. The Chakma form the largest group, making up 48.80% of the total Jumma population, followed by the Marma at 22.66% and the Tripura at 15.80%. Smaller but distinct groups include the Mro (5.30%), Tanchangya (4.60%), and several other indigenous communities such as the Bawm, Pankhua, Khumi, Lusai, Khyang, and Chak, who collectively account for 2.84%. Together, this chart highlights the demographic diversity of the CHT, where the Chakma and Marma communities constitute more than 70% of the overall Jumma population, while the remaining groups, though smaller in size, add to the region’s rich cultural mosaic.
Related Knowledges
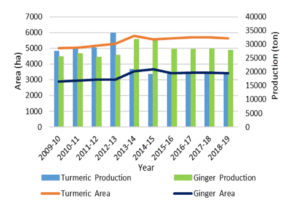
Ginger and Turmeric Production in the CHT
September 26, 2025
The chart presents the trends of turmeric and ginger production and cultivation area in Bangladesh…
Population ratio between the Jumma and Bangali in the CHT
September 9, 2025
Graph: Population ratio between the Jumma and Bangali in the CHT Source: BBS…